 Skip to the content
DEVICE PERFORMANCE MONITORING
Monitor performance of every deployed device
No more guessing how devices are doing in the field.
Monitor the health of your fleet in real-time with built-in tools for comparison between software versions, hardware versions and more. We handle the data collection and processing, you get the insights.
CAPABILITIES
Identify reliability issues and track changes between software releases without writing a single custom query.
Memfault collects a combination of built-in and custom metrics and makes all the data available to monitor, analyze and alert on. Build a dashboard to monitor your next release, track battery performance fleet-wide or alert on devices approaching known failure points.
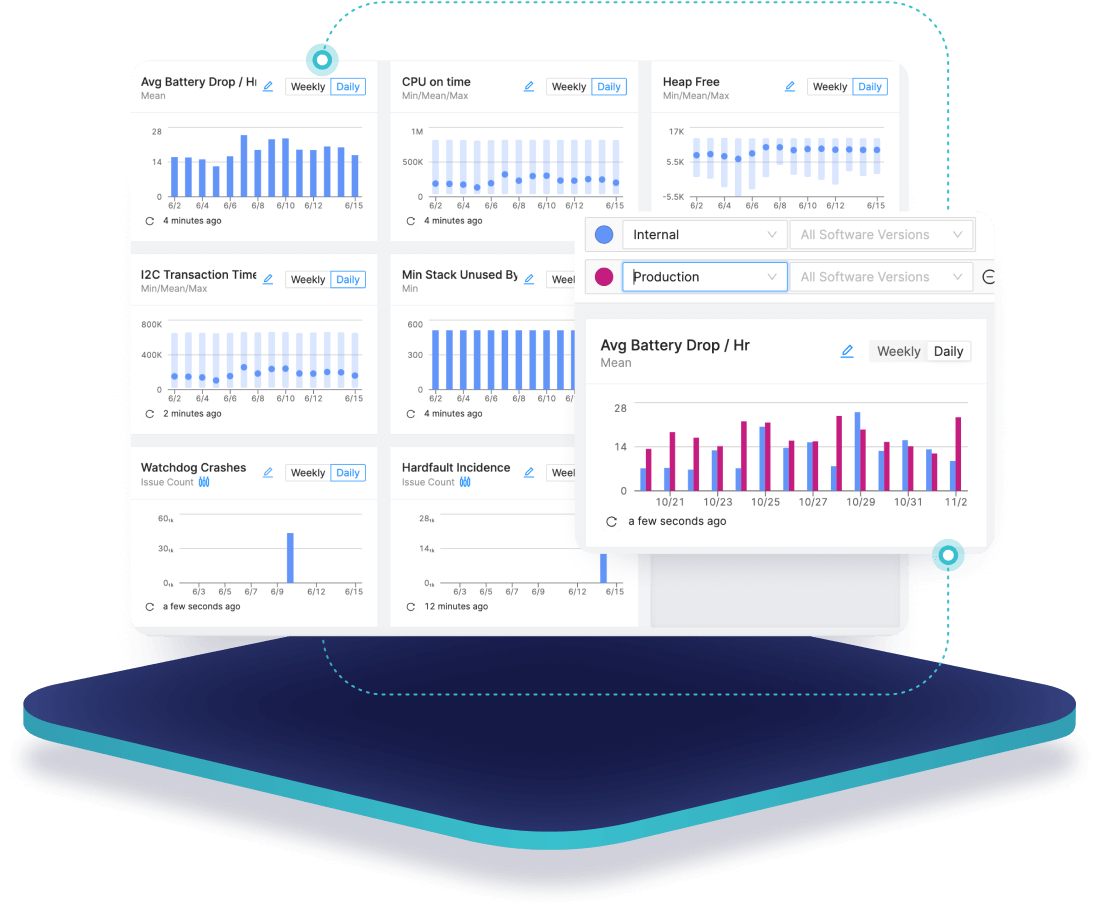
Track the metrics that matter to you
Get built-in tracking of firmware stability, connectivity performance, and battery life and then add tracking for your own custom metrics with a few lines of code.
Get targeted insights for any use case
Customize your dashboards to provide the answers your teams need, from monitoring your next release rollout to tracking battery performance fleet-wide.
Collect data automatically and efficiently
Once integrated Memfault handles data collection for you. Data is stored on device until connectivity is available and then sent to the cloud in small packets, keeping things efficient.
testimonials
What our customers say

“Memfault gives us the hard data to be confident in the reliability of our firmware and proactively take action, resolving issues before our users are impacted. These real-time device-level metrics and alerts have streamlined engineering processes and improved the overall health of our devices immensely. ”

“It’s vital to Airthings that we act as swiftly as possible to provide uninterrupted, reliable service to our customers, and Memfault is a key tool for us in doing this.”

“Because of the monitoring and automatic data collection capabilities that Memfault gave us, we were able to go to market faster with more confidence in the success of our launch.”
Features
Automatic metric data collection
- Collect Device Vitals out-of-the-box for instant insights into stability, battery life and connectivity performance
- Collect custom metrics without having to worry about coordinating across multiple teams to get the data
- Capture data even when the device is offline. Metrics are collected at configurable time intervals, stored on the device and sent when connectivity is available
- Configure collection frequency for your use case. Metrics can be collected once a day, or once per millisecond, depending on your platform and use case

Features
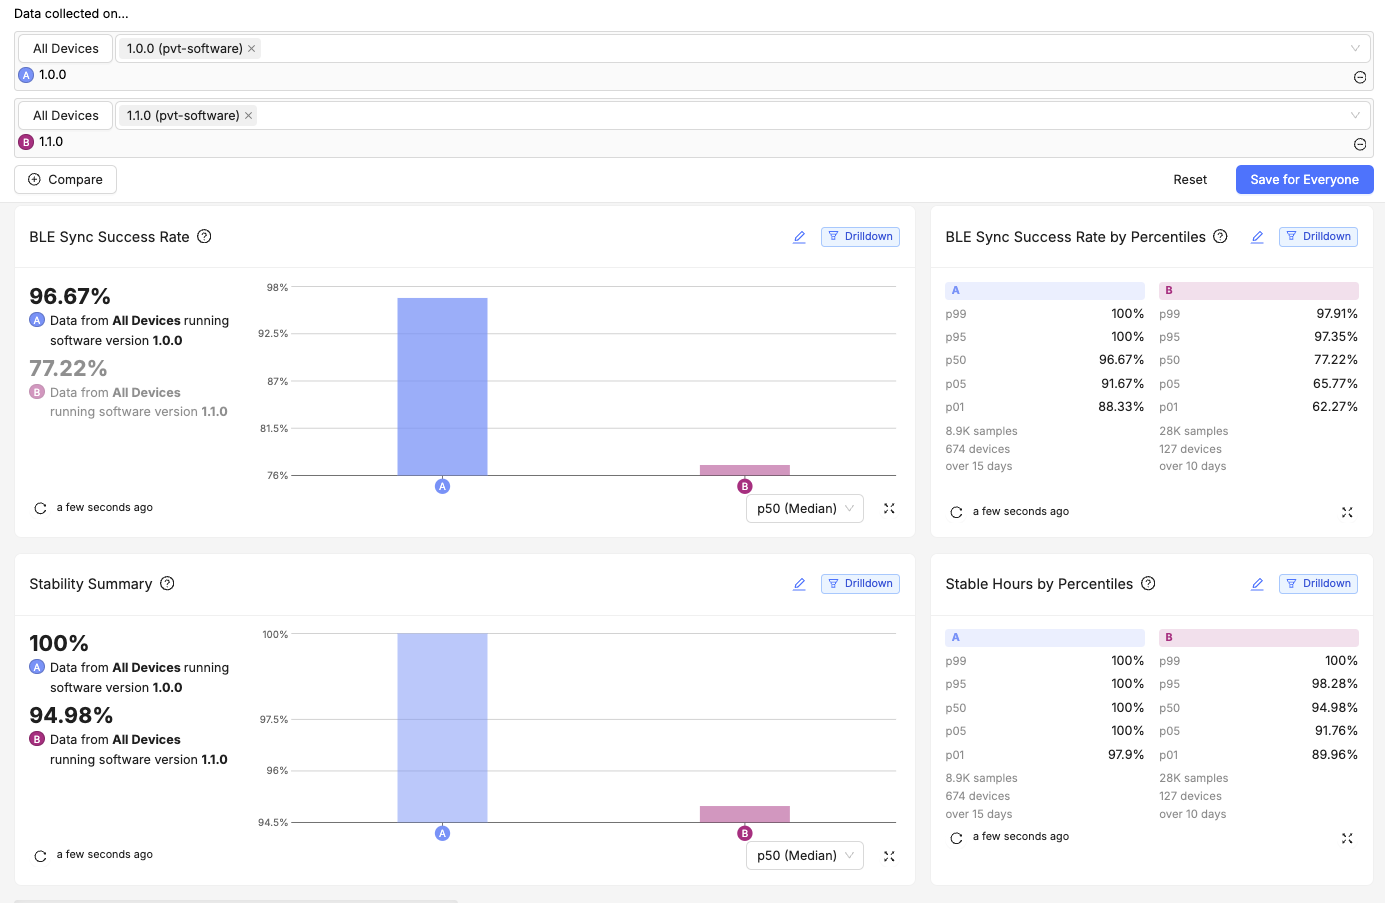
Customizable charts and dashboards
- Compare and segment your data with built-in tools. Compare performance and reliability between software versions, device groups and more
- Build custom dashboards for your use case. Create your own custom dashboards and configure the charts and filters for your specific use case
- View all data types in one place. View your metric data right alongside, trace counts, issue lists, reboots and more for a complete picture of device health
Features
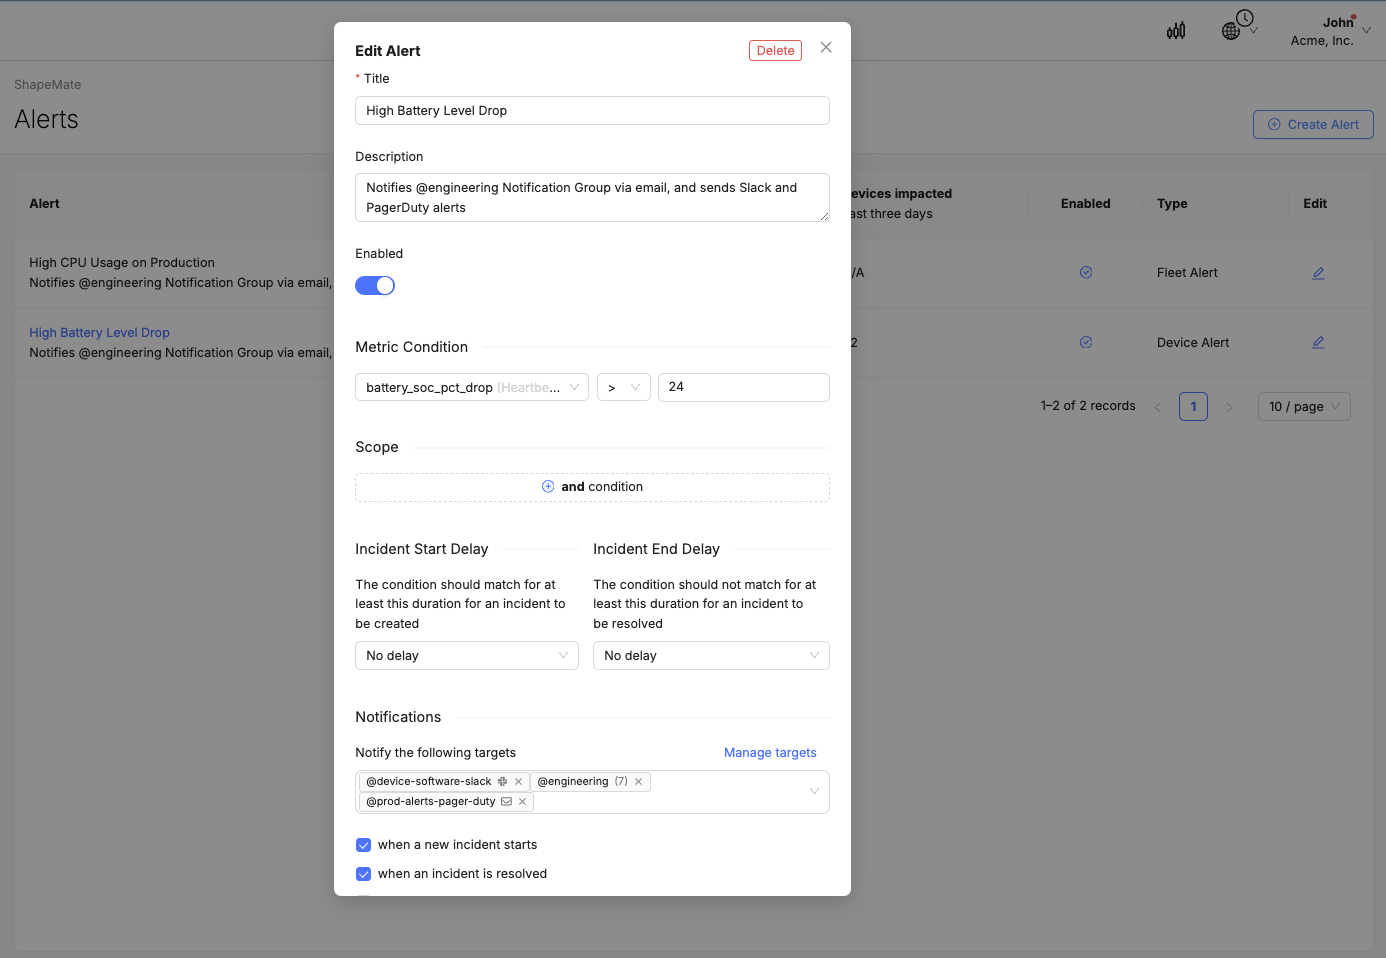
Automatic alerting
- Configure precise alerting conditions. Eliminate noisy alerts that don’t tell you anything with precise configurations for each alert you build
- Alert on fleet-wide changes. Alert based on fleet-wide changes in the upper, lower or average readings for metrics so you never miss a trend change or fleet wide issue
- Alert on device-specific changes. Alert when an individual device experiences an unexpected or undesirable change in metrics so you can react quickly to issues that might impact a customer
- Receive alerts in Slack, email, or somewhere else. Send alerts from Memfault into another connected system so you never miss a notification
Consolidate your embedded development tools
Better embedded development, right out-of-the-box
Memfault gives your embedded development team a modern set of software development tools to help them find and fix faults efficiently, and develop and maintain great connected products. It's purpose built for embedded devices, will work with your specific set-up and saves your team from wasting time maintaining custom systems.
Debug
Track and investigate issues as they happen. Get a list of issues prioritized for you based on impact and debug with automatically collected and decoded coredumps presented in a simple UI.
LEARN MOREAnalyze
Understand product usage, performance and reliability like never before. Collect product usage data from every device in your fleet even when they aren’t connected.
LEARN MOREDeploy
Rollout OTA software updates across your fleet with control and precision. Monitor the rollout with built in tools, set automatic alerts and abort with a single click if required.
LEARN MOREResources
Deep Insights into Performance Monitoring

Panic Case Study
Using Memfault, Panic can now monitor, manage and optimize their devices without relying on user involvement.
Read the Case Study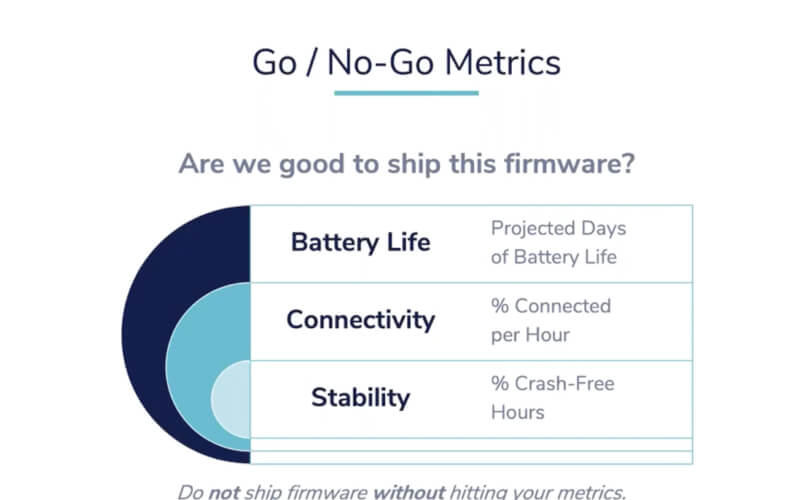
On-Demand Webinar: How to Monitor IoT Devices at Scale
Watch this recording to learn how to build out your monitoring solutions using metrics allowing you to scale your fleet.
Watch Now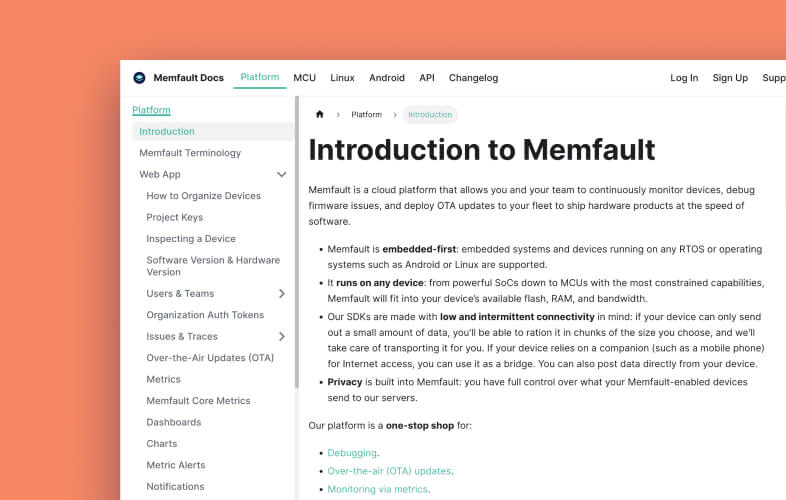
Documentation: Introduction to IoT Monitoring with Memfault
Read our docs to learn how to effectively monitor your embedded devices with metrics from Memfault's platform.
Read More