Skip to the content

Share
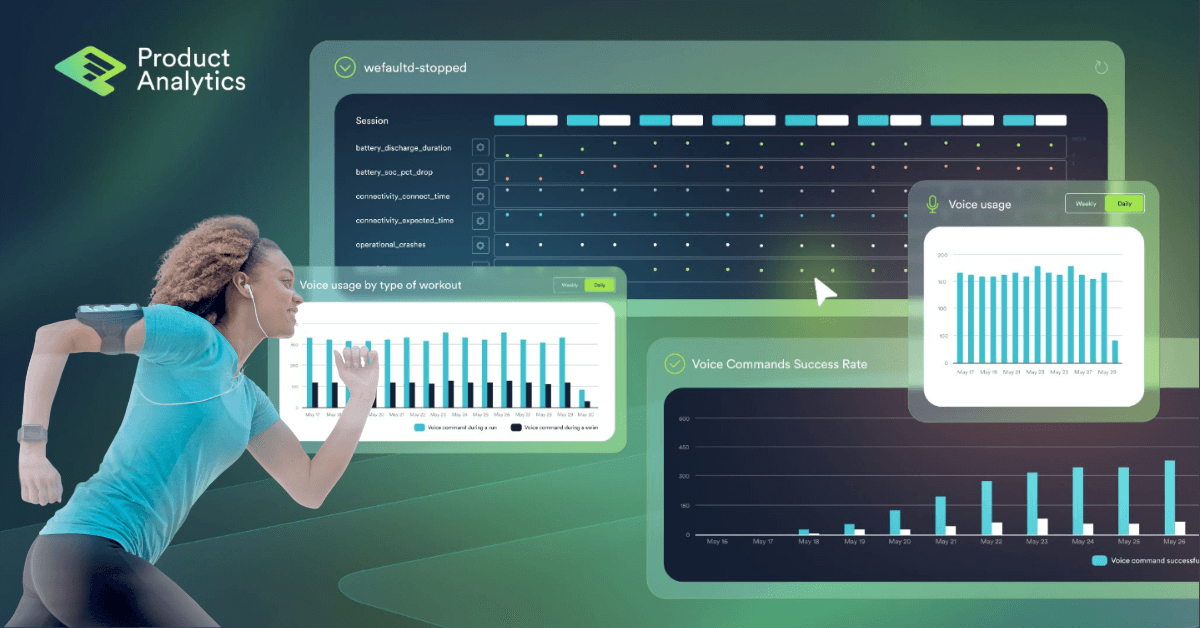
Building a reliable IoT product is a top priority for every embedded development team. But just being reliable doesn’t automatically mean your device is a great product. Great products take a lot more than that. And that’s why we are so excited to bring Product Analytics to Memfault.
Now, you’ll not only be able to ensure your embedded devices are reliable; you can also gain a deep understanding of how your IoT devices are actually used in the field. And you can use those insights to build truly great products.
Watch the Product Keynote Introducing Product Analytics
3 Benefits of Product Analytics in Memfault
While there are many other Product Analytics solutions already out there, none of them are designed to work within the specific constraints of an embedded device. Updates to the SDK (Android, Linux, MCU) enable Memfault to capture new data, while enhancements to the web app’s functionality allow users to analyze data in innovative new ways. This provides several distinct advantages.
1. Works with any connectivity set-up
Memfault collects data directly from the device, at a system level, regardless of whether the device is connected at the time or not. It is also designed to work even when bandwidth is extremely constrained, chunking data into very small packets to keep things efficient.
Unlike with other Product Analytics solutions, you will be able to get great data without sacrificing performance. And that data will have no gaps, regardless of connectivity state, giving you a better understanding of real usage.
2. The complete picture, all in one place
Memfault brings together information on product usage with detailed insights on device reliability to give your team the complete picture of product quality and performance, all in one place.
It allows you to consolidate to one system and integrate one SDK, saving precious space on these constrained devices. Utilize all your existing infrastructure and start collecting great data straight away.
3. Better collaboration between product and engineering teams
Now, your entire development team can treat Memfault as the single source of truth for data about your devices. Combine observability with analytics and a complete OTA update management system.
Collaborate more effectively with your whole team by asking questions of the same data, in the same system and within the context of the complete picture of device and fleet health.
Product Analytics Demo
Let’s get into what Product Analytics actually looks like in Memfault.
Watch this product demo video to see some of the new functionality. You’ll learn how to use Product Analytics to track product adoption, feature usage, feature reliability, and overall product performance.
Real-World Example: Product Analytics for a Wearable Fitness Device
Let’s look at a product analytics use case that is now possible with the new feature set in Memfault.
To illustrate the functionality, we’ll use a fictional example of a wearable health and fitness device. This device is Bluetooth-connected, battery-powered, and has two major features we will track and analyze: “Workouts” and “Voice Commands.”
In the following sections, we’ll walk through some examples of what you can now use Memfault to do:
- Capture Device Feature and Function Usage with Sessions
- Investigate Feature and Function Usage per Device
- Track IoT Product Usage and Adoption Fleetwidev
- Analyze Feature Reliability and Performance
- Analyze Feature Usage Impact on Device Performance
- Segment Data for More Detailed Investigations
1: Capture Device Feature and Function Usage with Sessions
Sessions are a new report type to capture device activity, comparable to our existing hourly “Heartbeat” reports. The key difference: while Heartbeats are defined by time and do not change relative to device activity, sessions are reported only when the associated feature or function is active, and they will only last as long as that feature or function is active.
Heartbeats are still great for overall device reliability, while sessions are great for more focused insights on feature and function-specific reliability and performance.
Memfault users can define sessions to track the relevant activity on their devices. Then, they can add tracking of any health and usage metrics to be captured in each session, giving them a granular view on the data by session type. This session-based data can then be analyzed on a per-device level or fleetwide as detailed in the rest of this blog.
In the following examples we have two session types:
- Workout: covering the usage of the workout tracking feature on the device
- Voice Commands: covering the usage of a Voice Command feature on device
The example used is entirely hypothetical. It’s worth restating that sessions are use case agnostic; you can apply them differently depending on what makes sense for your device.
2: Investigate Feature and Function Usage per Device
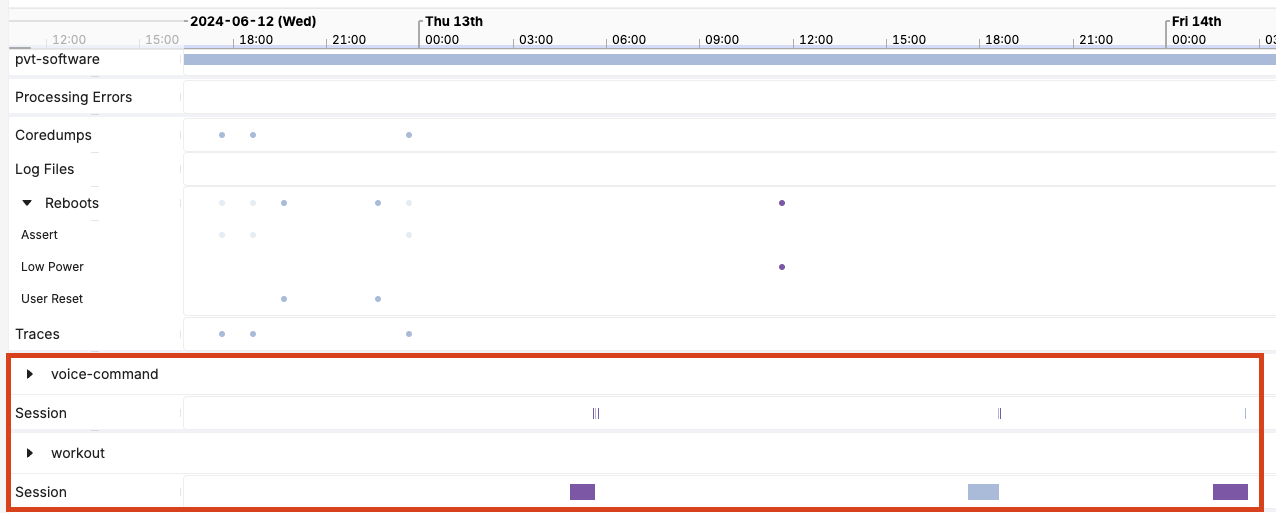
Sessions are reported on the Device Timeline. They can be of varying duration, as dictated by the amount of time that feature was in use.
Below, the boxes in the highlighted section show that we can see when sessions occurred. We can also see whether there are any device reliability issues that align with activity such as traces, coredumps collected, or unexpected reboot events, as shown above the highlighted section.
If a user wants to investigate either a “Voice Command” or “Workout” session further, they can click down into the session data to investigate metrics associated with each session.
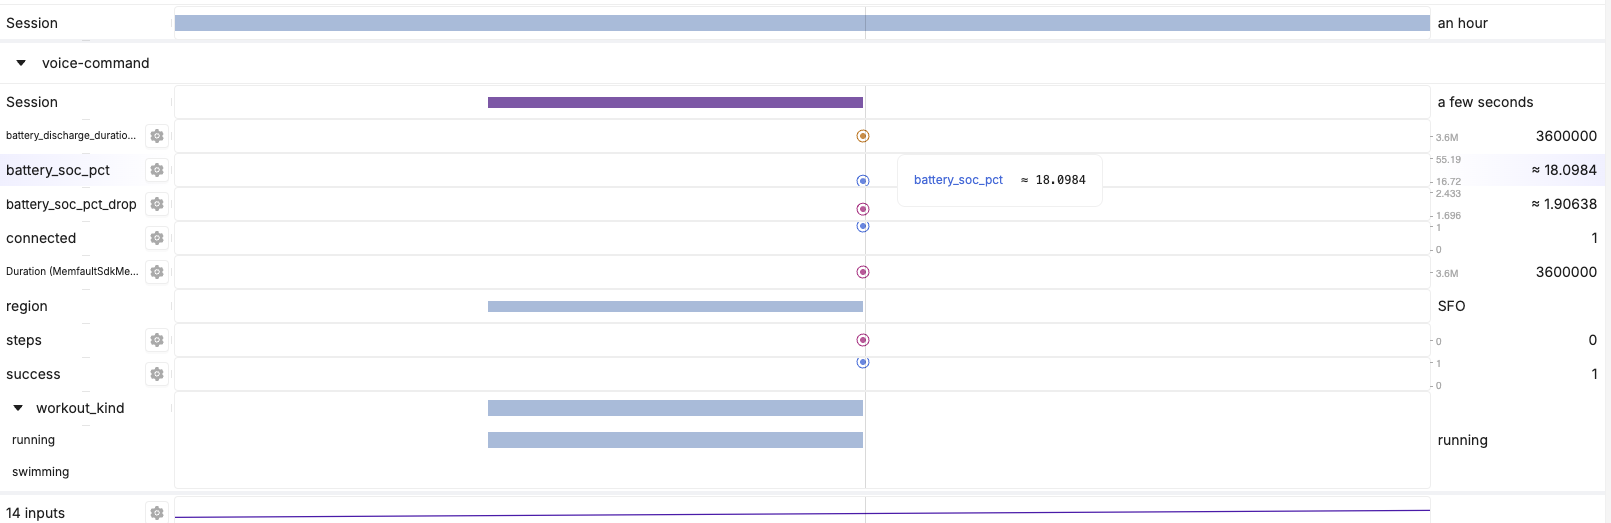
In the example below, we are tracking various metrics like battery state of charge and the type of workout this Voice Command session used. We can see various information about the condition of the device and the impact of this session such as:
- The battery was 18% charged at the time of the session
- The battery dropped 1.9% during this session
- The device was connected at the time of the session
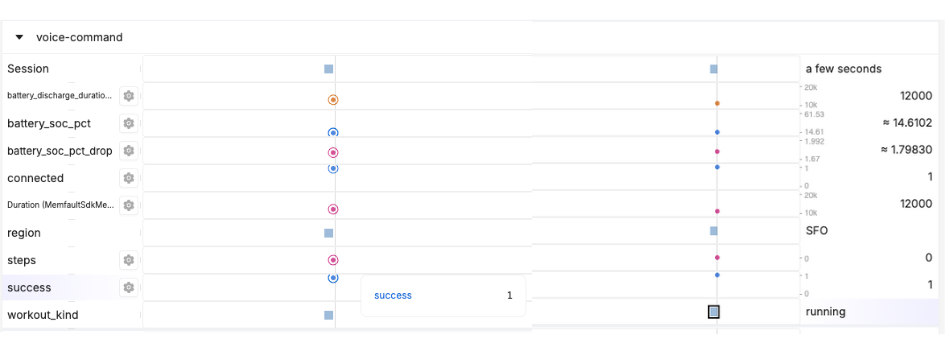
Below, we can see critical information about the Voice Command (namely, that it was successful) and obtain additional contextual information (it was used during a running workout).
3: Track IoT Product Usage and Adoption Fleetwide
Memfault users will also be able to analyze all of the device-level data aggregated across all reports of sessions across all their devices.
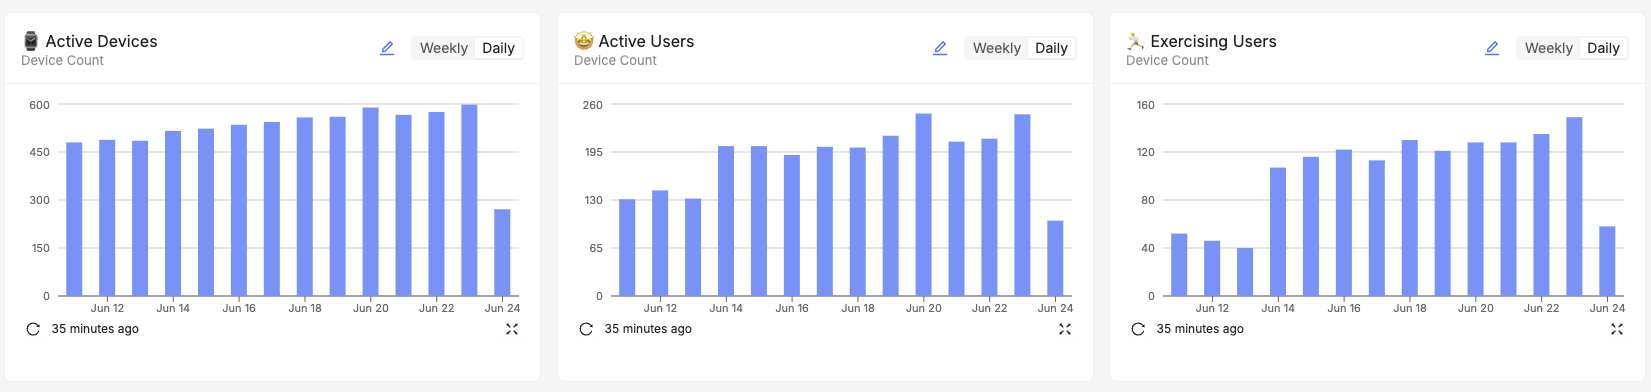
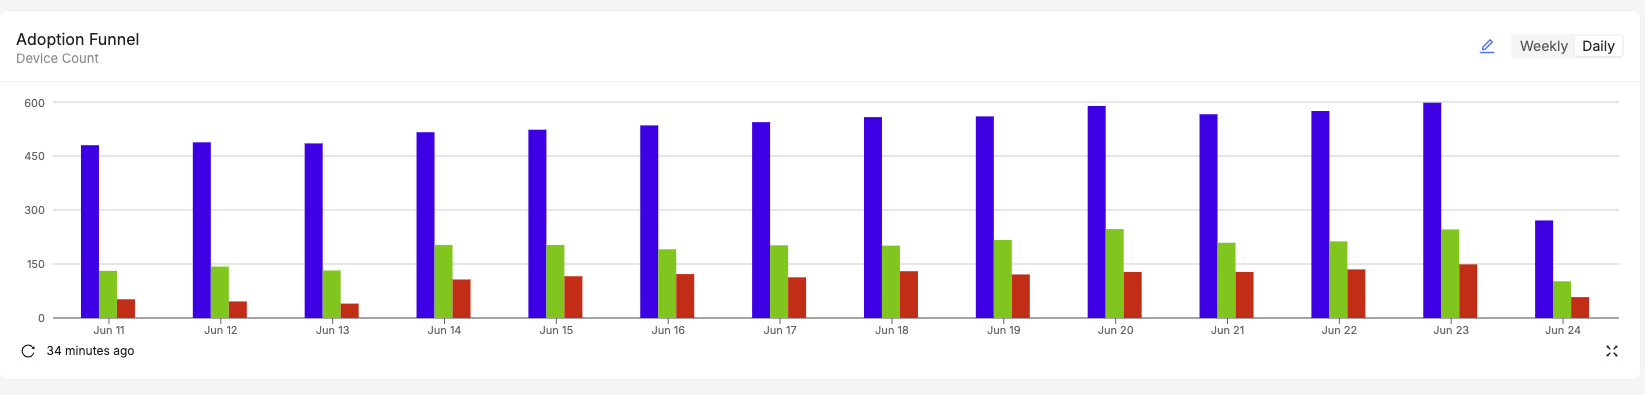
In the below example, we are tracking product adoption and usage using a combination of session data to differentiate between different types of usage. We are looking at:
- Active devices (left) telling us devices that have powered on and checked in
- Active users (middle) showing devices that show actual usage, in this case a step count above zero
- Feature usage (right) showing devices that have used a feature we care about, in this case a voice command
We could also decide to combine this into a single chart showing all the same data but in one place for a direct comparison. In this case, we have the same three segments, making it easier to get an at-a-glance view on adoption on the same scale.
4: Analyze Feature Reliability and Performance
Naturally, Memfault users can also analyze the reliability of specific features using their fleetwide data. In the example below, we are tracking a count of total voice command usage (left) and a count of successful vs failed voice commands (right).
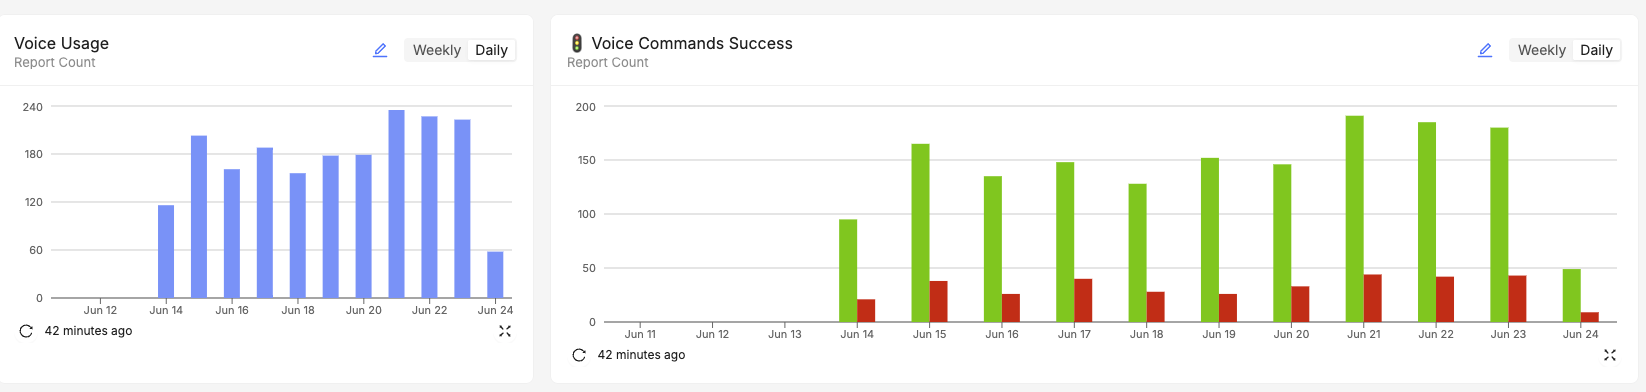
- We can see some failures occurring (indicated by red bars in the right chart).
- We are counting total successes and failures without considering how many devices have experienced a failure.
- We could easily modify the chart to evaluate the impact rather than just the volume of occurrences.
- We could apply a filter or compare by software version to identify if the failures are isolated to a single version.
5: Analyze Feature Usage Impact on Device Performance
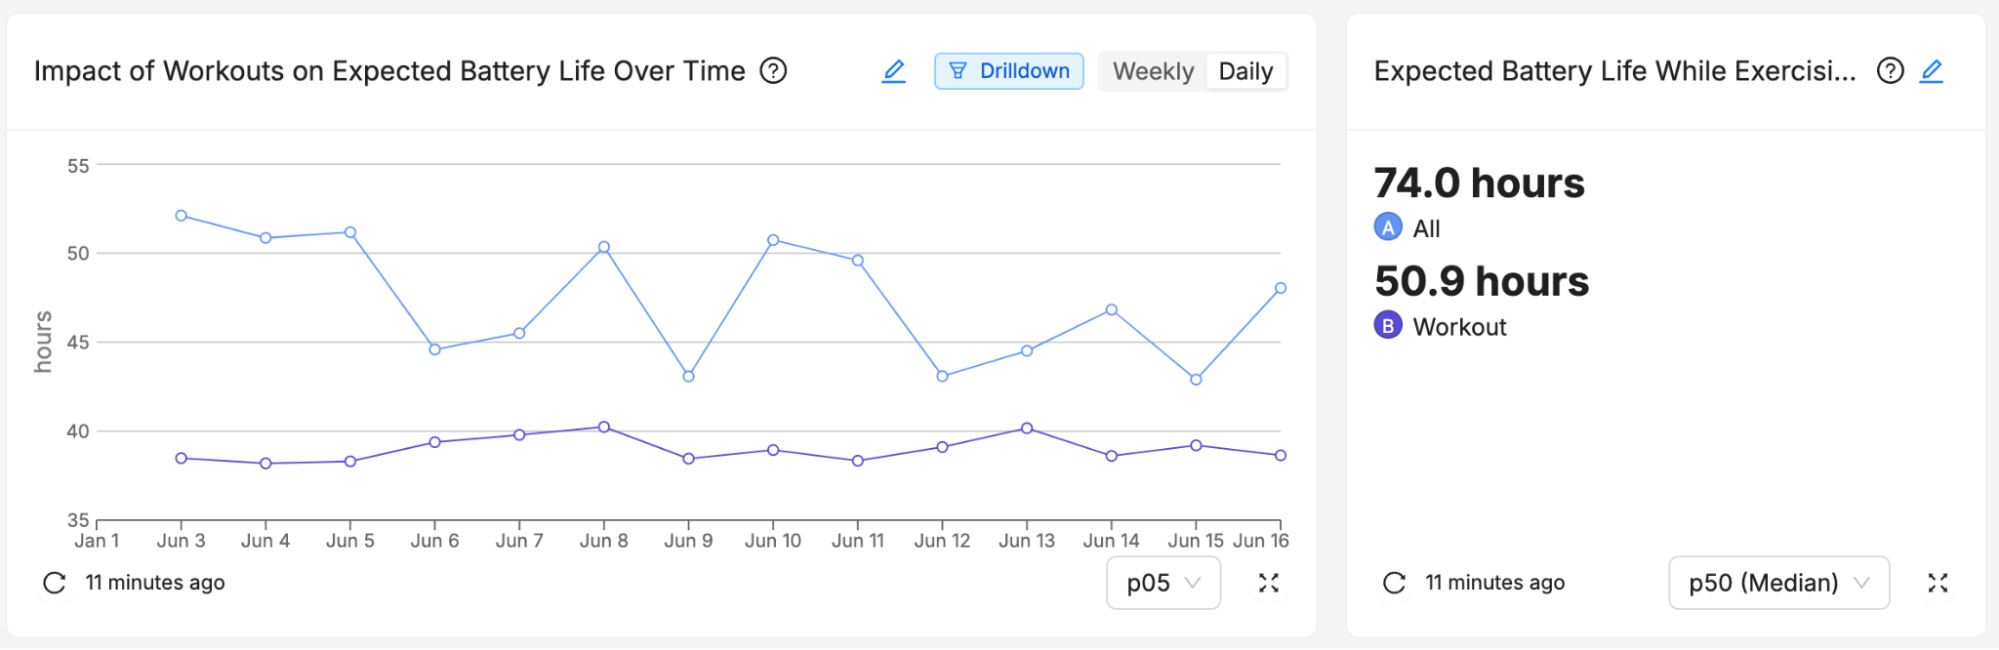
Users can track the performance impact of usage of specific features. In the example below, we are comparing the expected battery life during regular usage vs during workout usage.
As expected, we see workout functionality impacting battery life. We can track the impact both over time (left) to monitor for unexpected changes and we can get a summary of all data (right) to monitor overall performance.
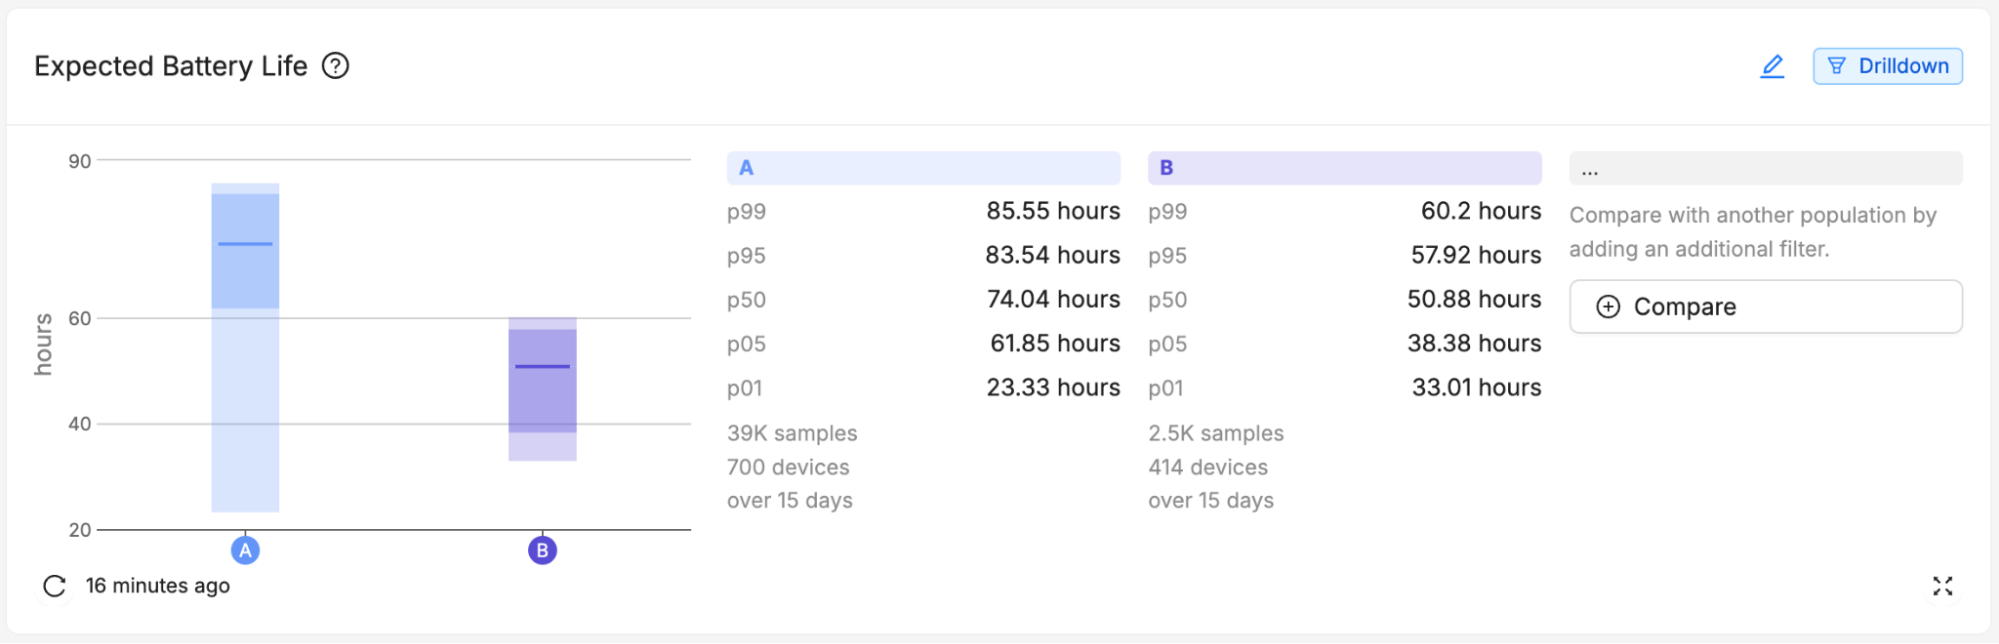
Users can also get a view on the distribution of reports as percentiles to understand the difference between normal, best, and worst performance. Below is the comparison of battery life by percentiles for All usage (A) vs Workout usage (B). We see a bigger distribution for A, as would be expected given the variability.
We can also see how the software versions we are releasing impact performance and reliability for specific features. In the example below, we are analyzing the same data as above, but adding in a comparison between our launch software version (1.0.0) and our new software version (1.1.0). In this case, we notice a regression in performance in our newest version.
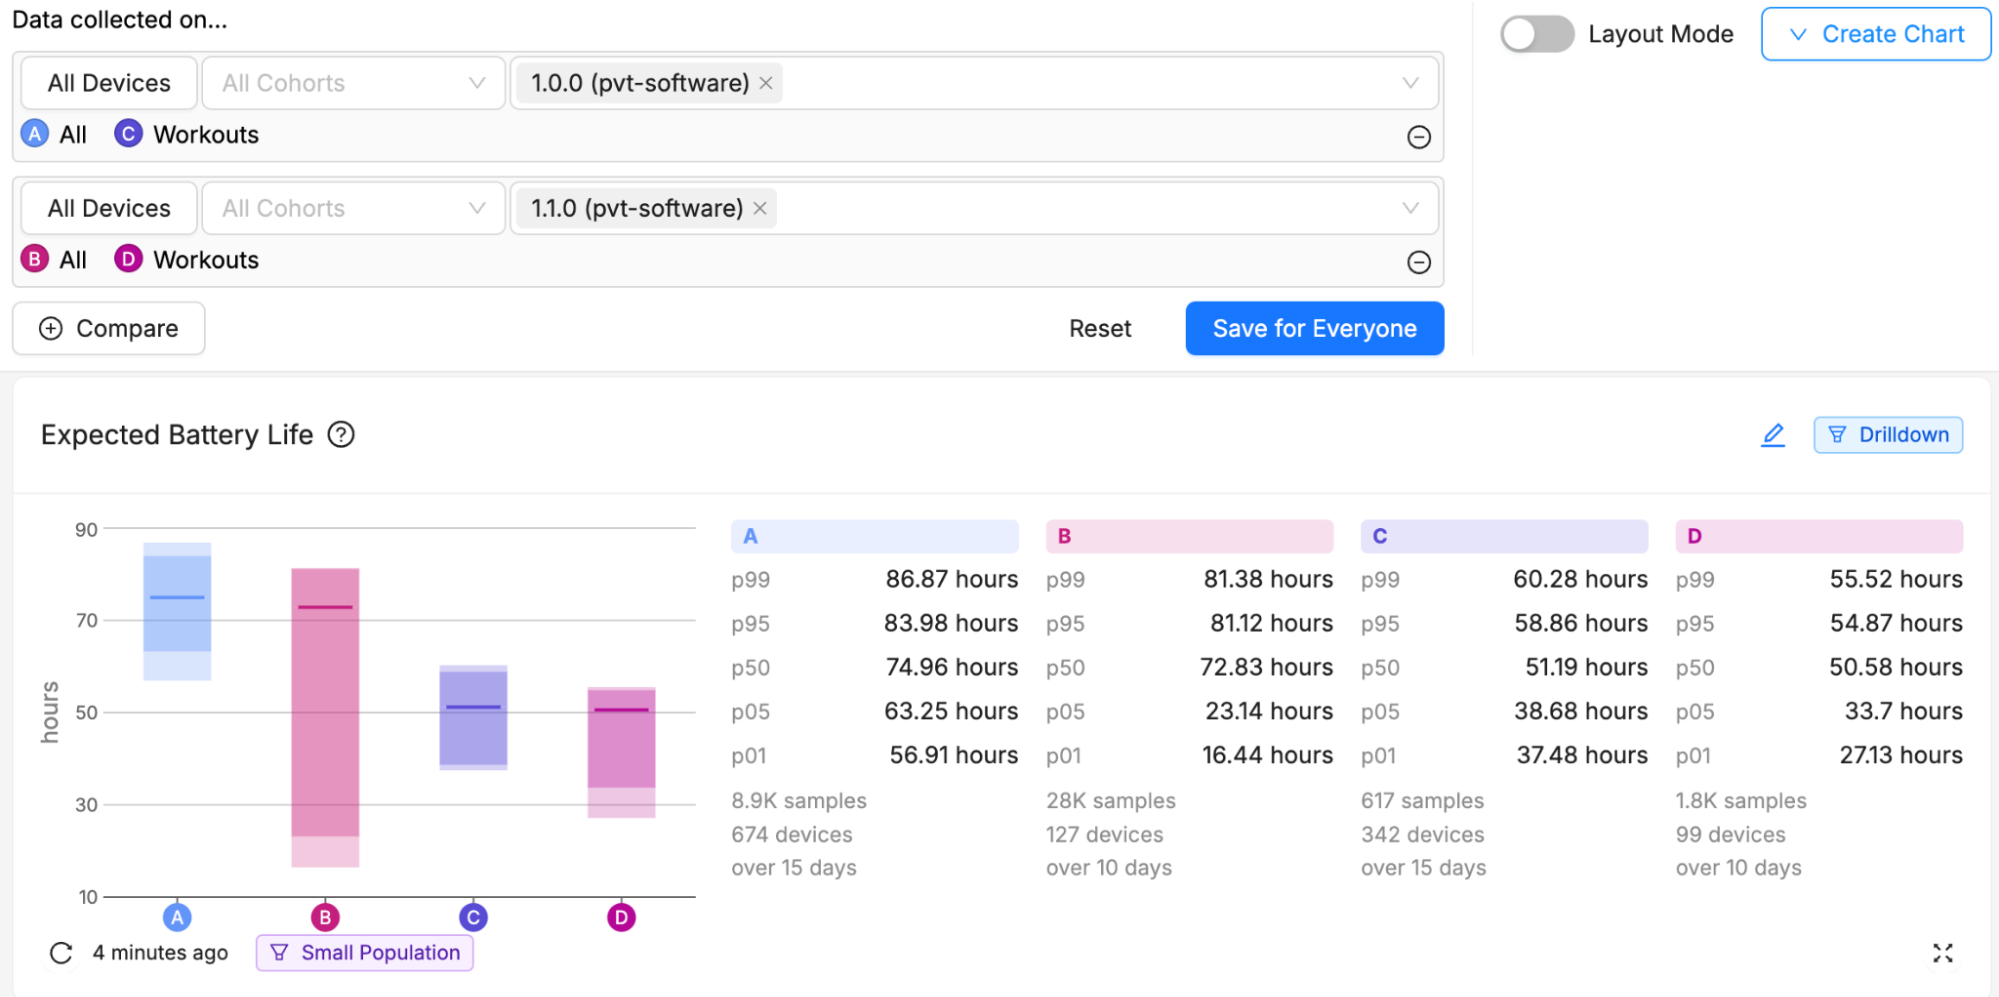
This data gives users a complete picture of the impact of feature usage on overall device performance rather than, in the previous section example, the reliability of the feature itself. Combining with software versions lets your team gauge the impact their ongoing efforts are having on these important measurements.
We could also run this kind of comparison but using a filter for environmental factors that would be difficult to account for during testing. For example, if we wanted to understand how differences in environmental conditions between regions impacted battery life, we could build a comparison set based on device deployment locations.
6: Segment Data for More Detailed Investigations
One of the most powerful additions of the new feature set is the ability to do some very sophisticated segmentation of data combining both session type and metrics conditions.
In the example below, we are looking at the battery drop for workout sessions that are running workout sessions and segmenting the data based on the number of steps. Segment A is running workouts with a step count less than 2k and segment B is running workouts with step count between 2k and 5k.
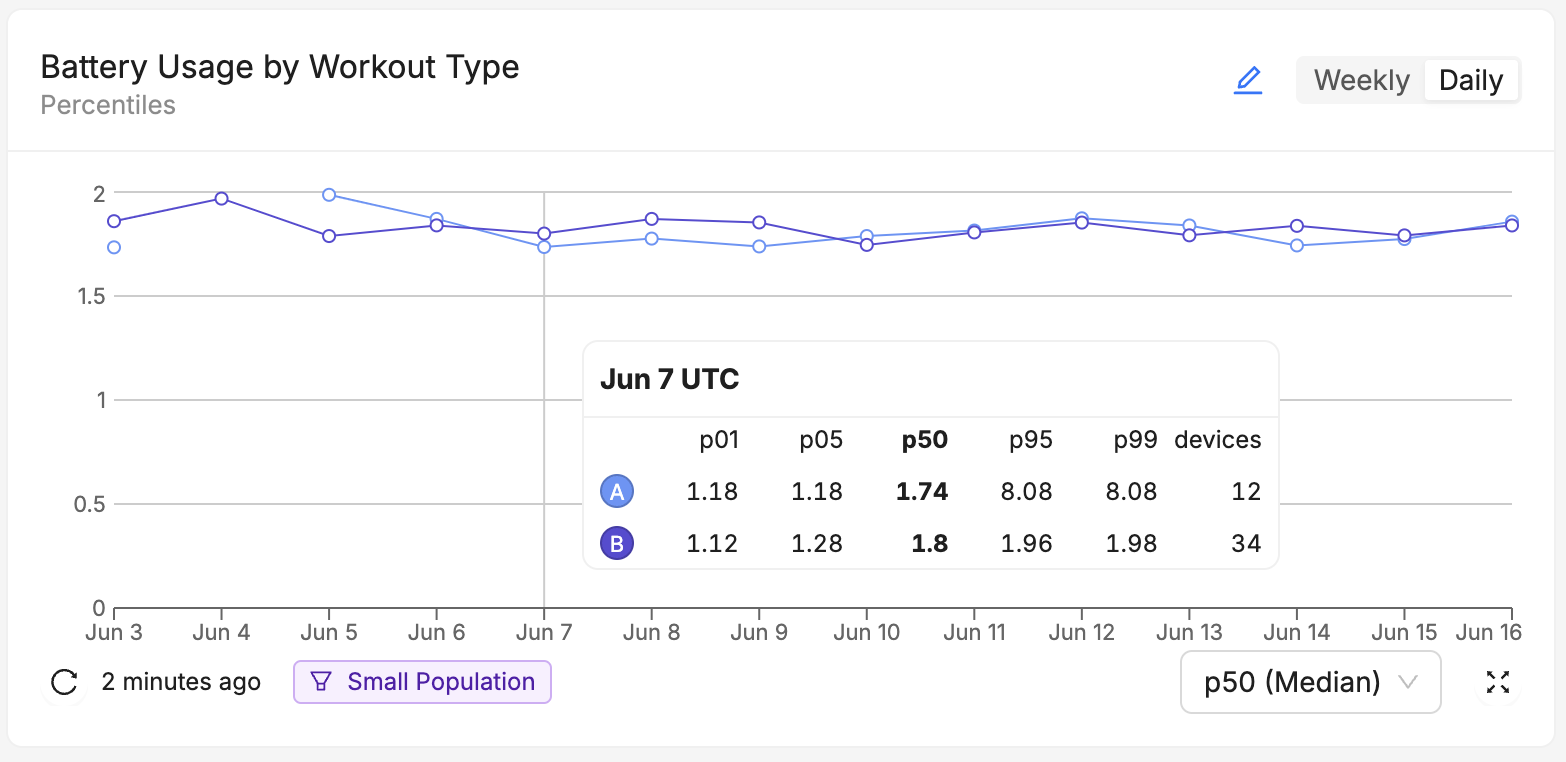
Below is an example of how those segments are constructed when building this chart. We are combining the session type (workout) with several metrics, one to dictate the type of workout (running) and then two more to build the segment based on steps in that workout session.
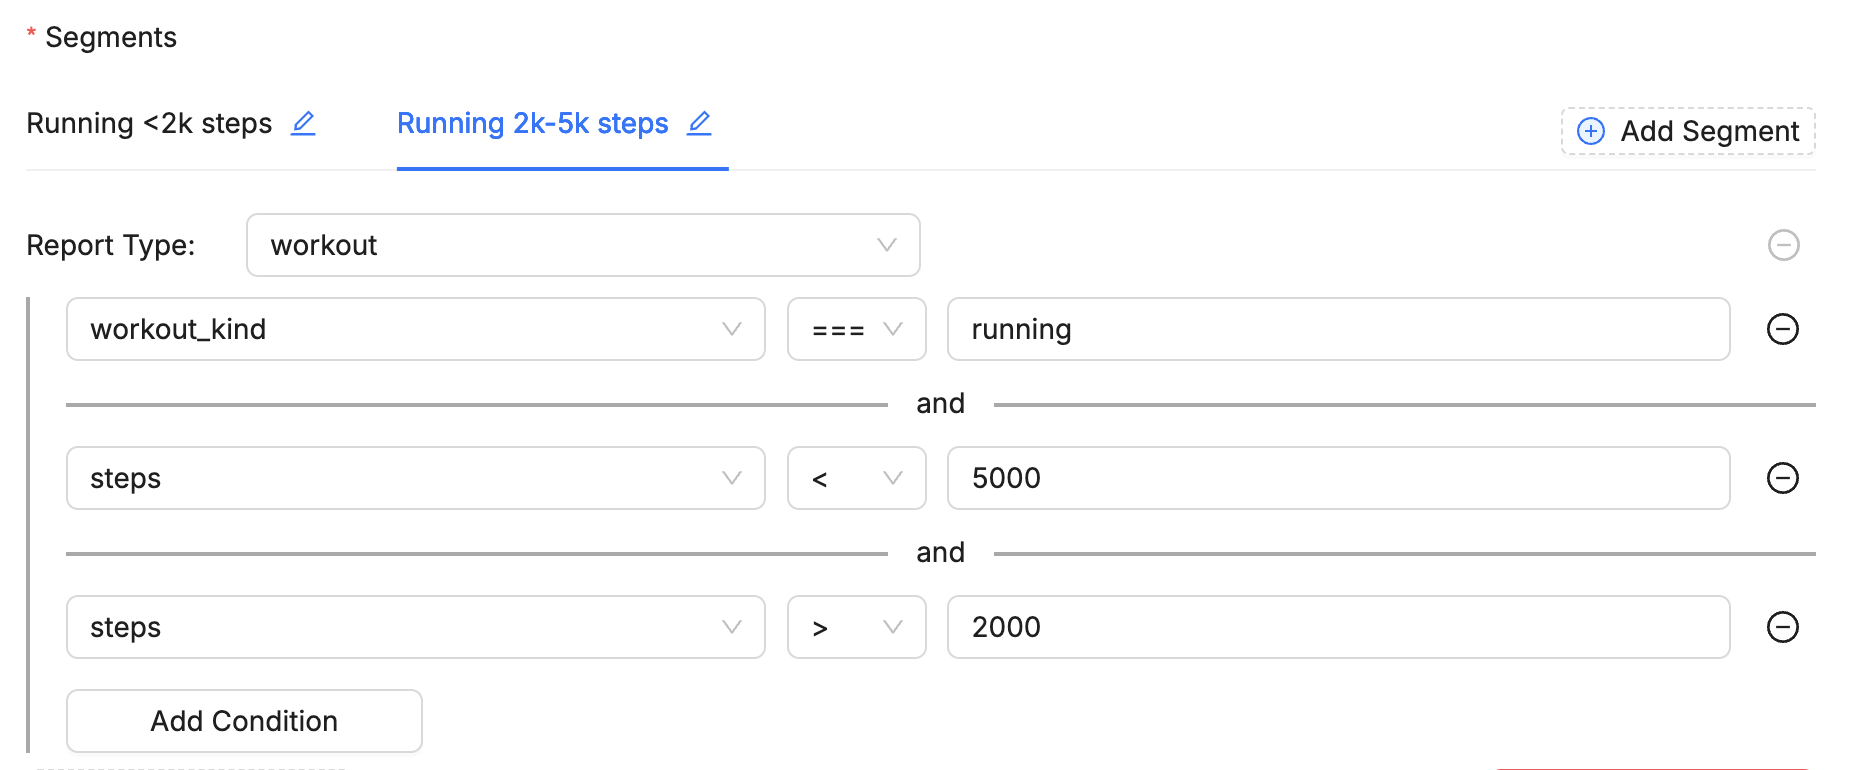
This would still be considered a relatively simple segment, but we could add more conditions dependent on the data we track. For example, we might want to limit both segments to a particular battery temperature range or state of charge to eliminate other factors influencing the data.
Users can also build comparison segments based on specific device characteristics and attributes and filter all data in the dashboard by those filters. Below we are filtering based on a device attribute (in this case, deployment location) and we can see that dashboard filter (highlighted top left) combine with our chart level segments to further break down the data.
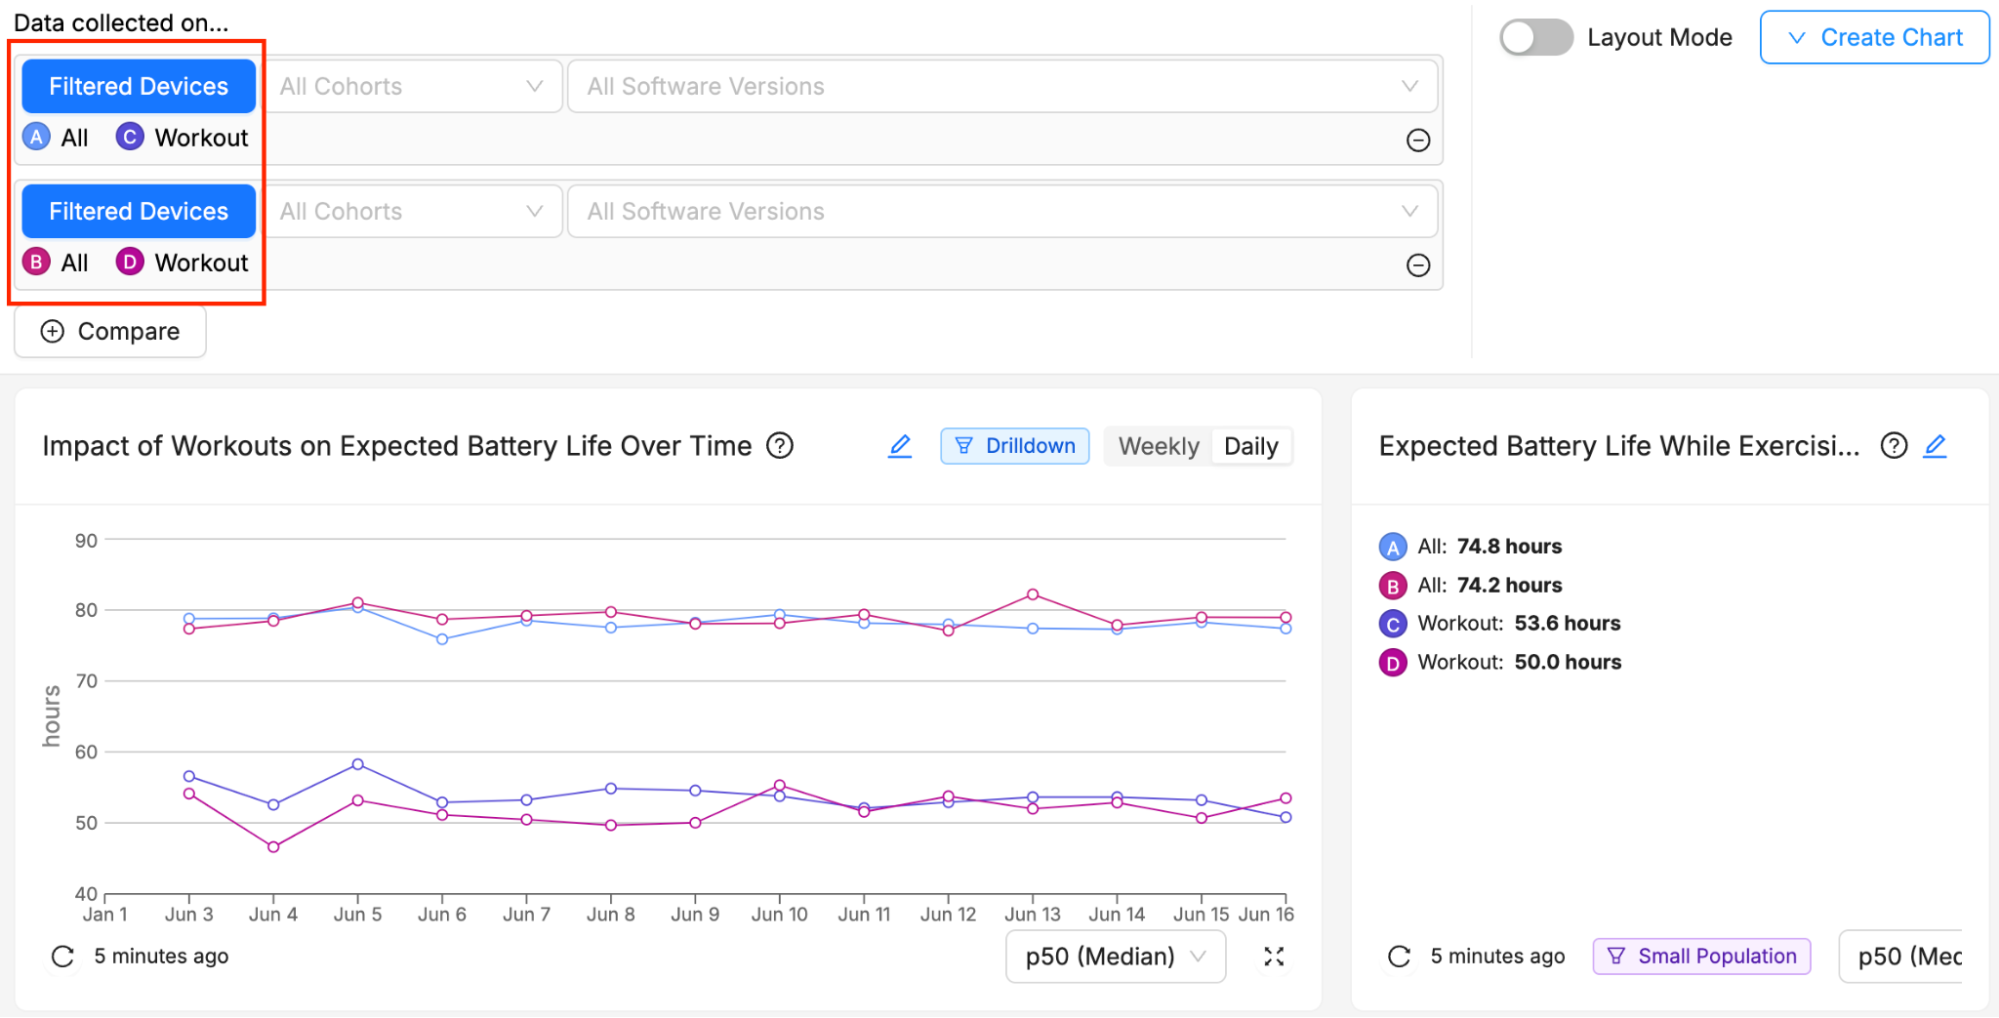
In this example, we might want to understand the differences in product usage, reliability, and performance between two distinct deployment locations. In doing so, we can gain insights into usage differences and also open up other avenues for investigation.
Product Analytics: Your View Into Real-World Usage
It’s time for embedded development teams to have a toolkit as robust as those used by their cloud and app-focused colleagues. That’s exactly what we are building at Memfault. Product Analytics adds another critical capability to Memfault, allowing embedded teams to meet more of their needs with a single tool and SDK integration.
We hope this blog has given you valuable insights into our new Product Analytics feature set. With these features, Memfault can provide extremely detailed information on product usage, performance, and device reliability. Combining overall device reliability data with product usage analytics will unify embedded development teams, enabling them to make well-informed decisions based on a comprehensive view of product health.