DEVICE DEBUGGING
Remote debugging for firmware failures
Never waste time reproducing an issue again.
Memfault automatically and remotely collects coredumps, logs, traces, and metrics from your devices so you have everything you need to solve problems when they happen, not days later.
Capabilities
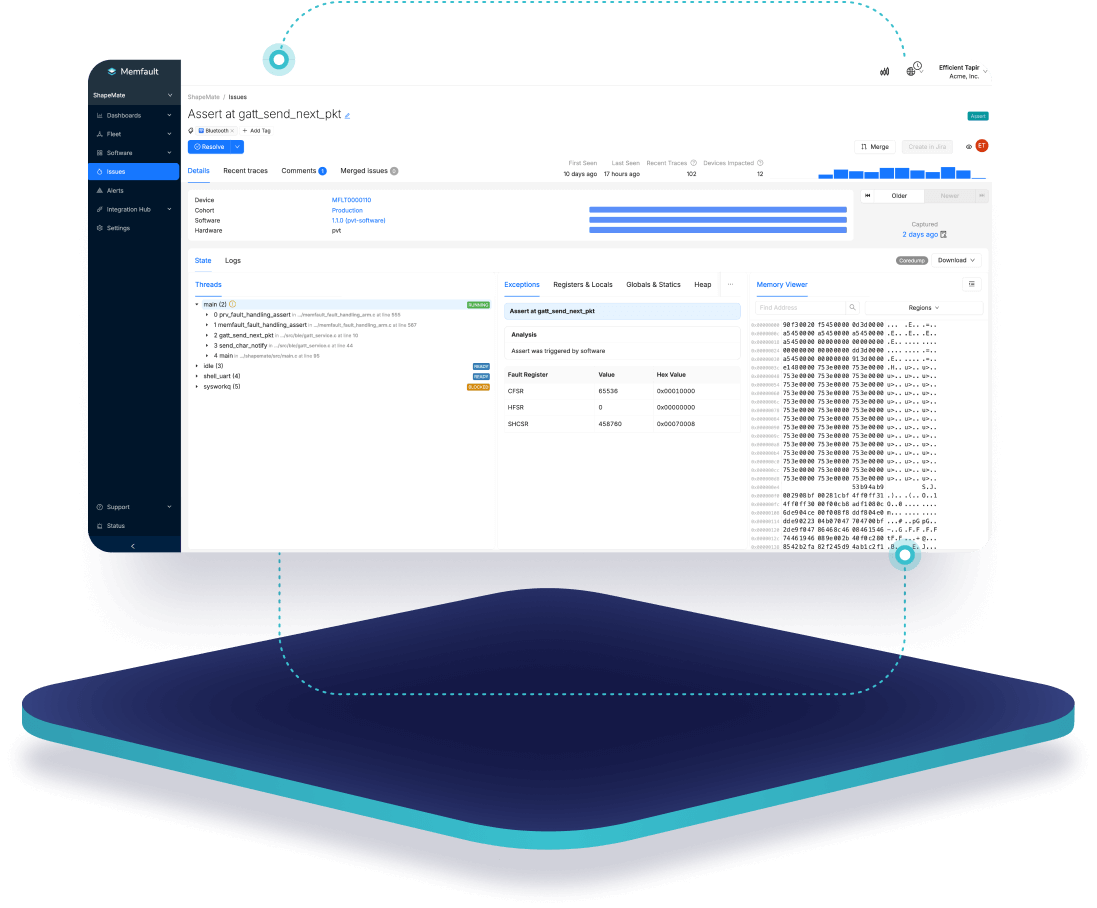
Catch every crash, get the full context and prioritize problems with zero extra effort.
Memfault gives you the data you need to solve problems quickly and efficiently without needing access to the device. Less fault finding, more fault fixing and a whole lot faster.
Automatic data capture from deployed devices
Our SDK manages the collection of crashes, errors, logs and metrics from your devices. You don't need physical or remote device access. As long as it can get connected (even if it's intermittent) the collection is done for you.
Built-in issue prioritization tools
Memfault automatically groups related issues together and prioritizes based on both the frequency of each issue and the number of unique devices impacted by each issue. No more guessing which problem should be fixed first.
The full picture of every problem
The Memfault SDK is integrated at the system level, captures a stack trace when something goes wrong and provides device health metrics so you can understand what happened without having to reproduce the issue.
testimonials
Hear from our customers
Features
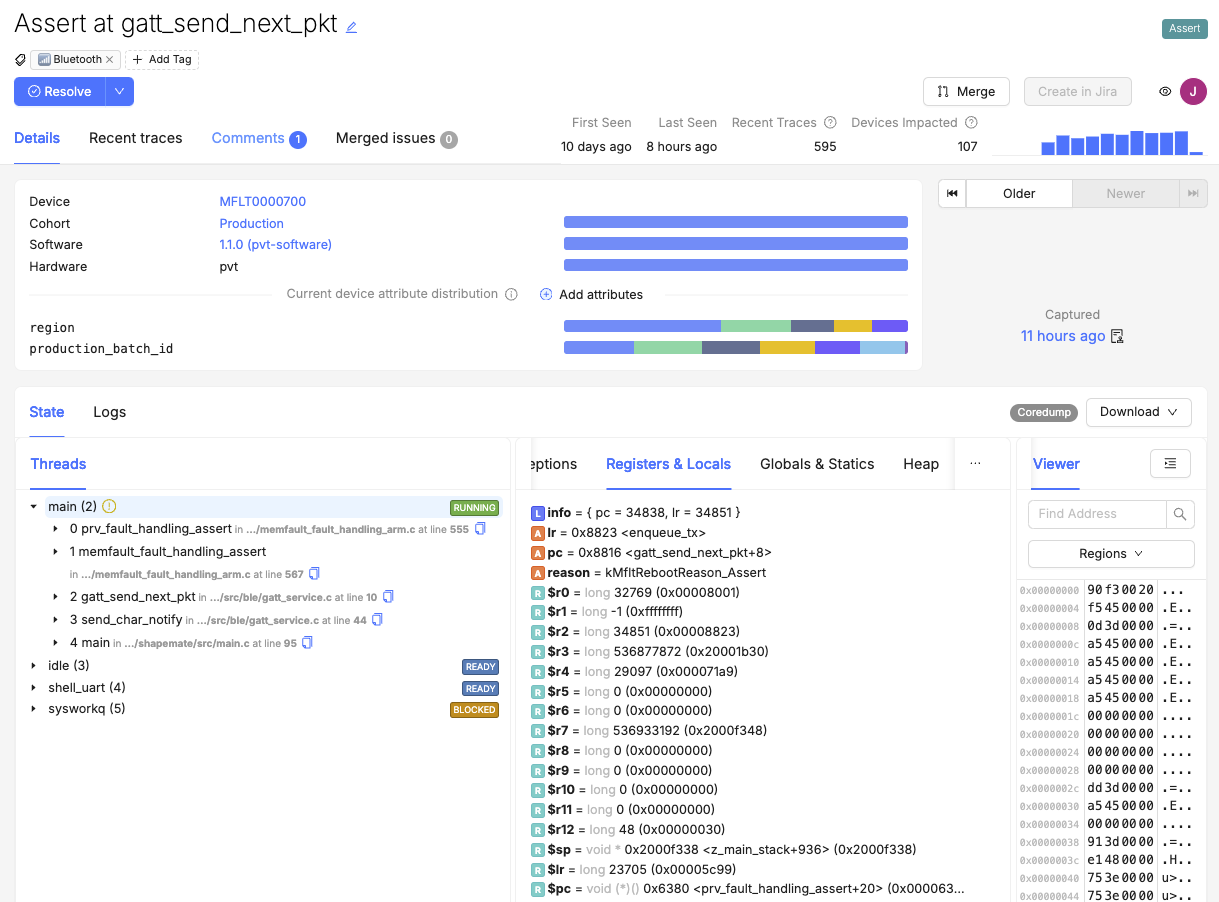
Easily investigate errors and crashes
- View system-level data, app data and logs in one place whenever a coredump is captured on your devices
- Easily jump between traces of the same issue and drill down to the impacted device for further investigation
- Investigate correlations and distributions between issues and software versions, hardware versions or device attributes (like production batch)
- Efficiently manage, triage and collaborate on issues with status management, custom tagging and commenting and collaboration
Features
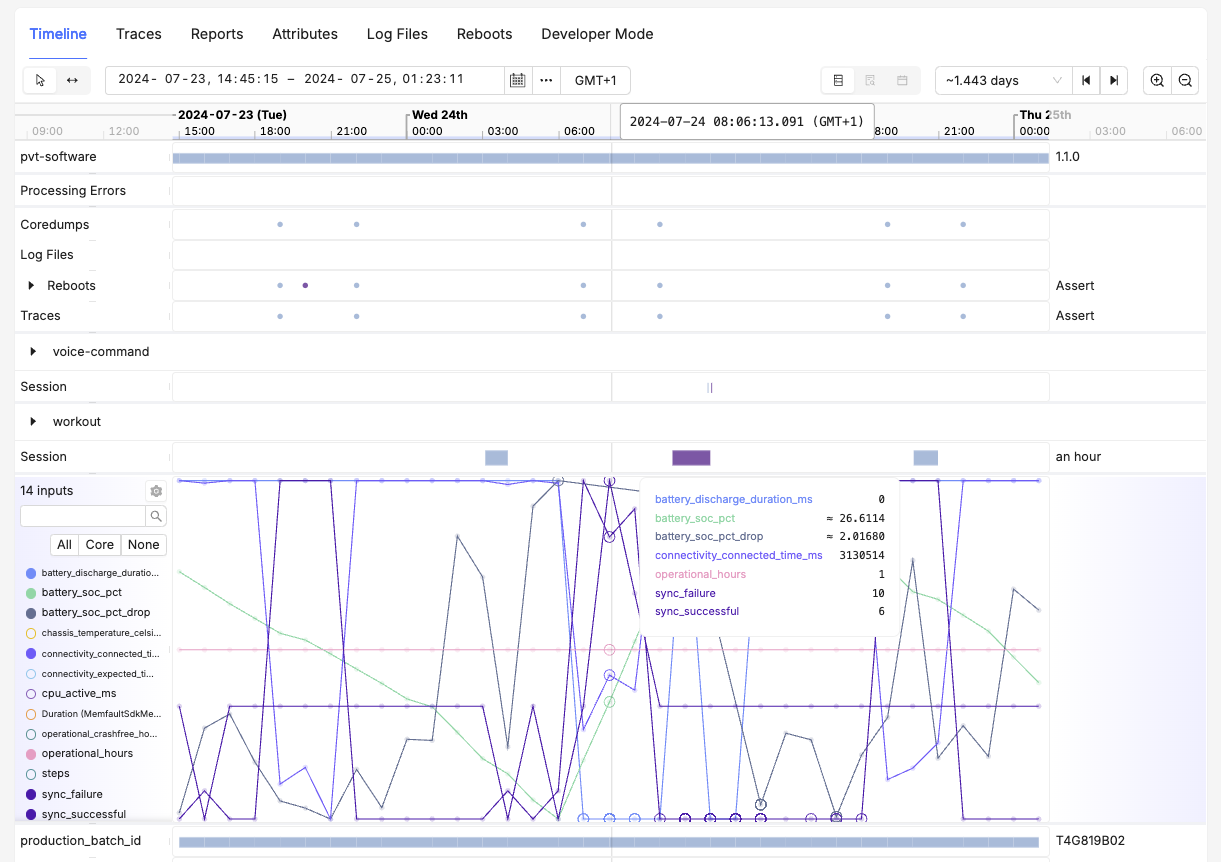
View activity over time for each device
- Reboots, traces, coredumps, logs and metrics in one view so you can easily identify exactly what’s happening on each device, at any time
- See detailed health and condition metrics for each device displayed overtime and understand how changes in device condition can impact reliability or performance
- Easily navigate to specific points in time and see everything that happened without having to trawl through logs or jump between systems
- Analyze feature usage patterns and understand how usage of a feature impacts the condition and performance of devices
Features
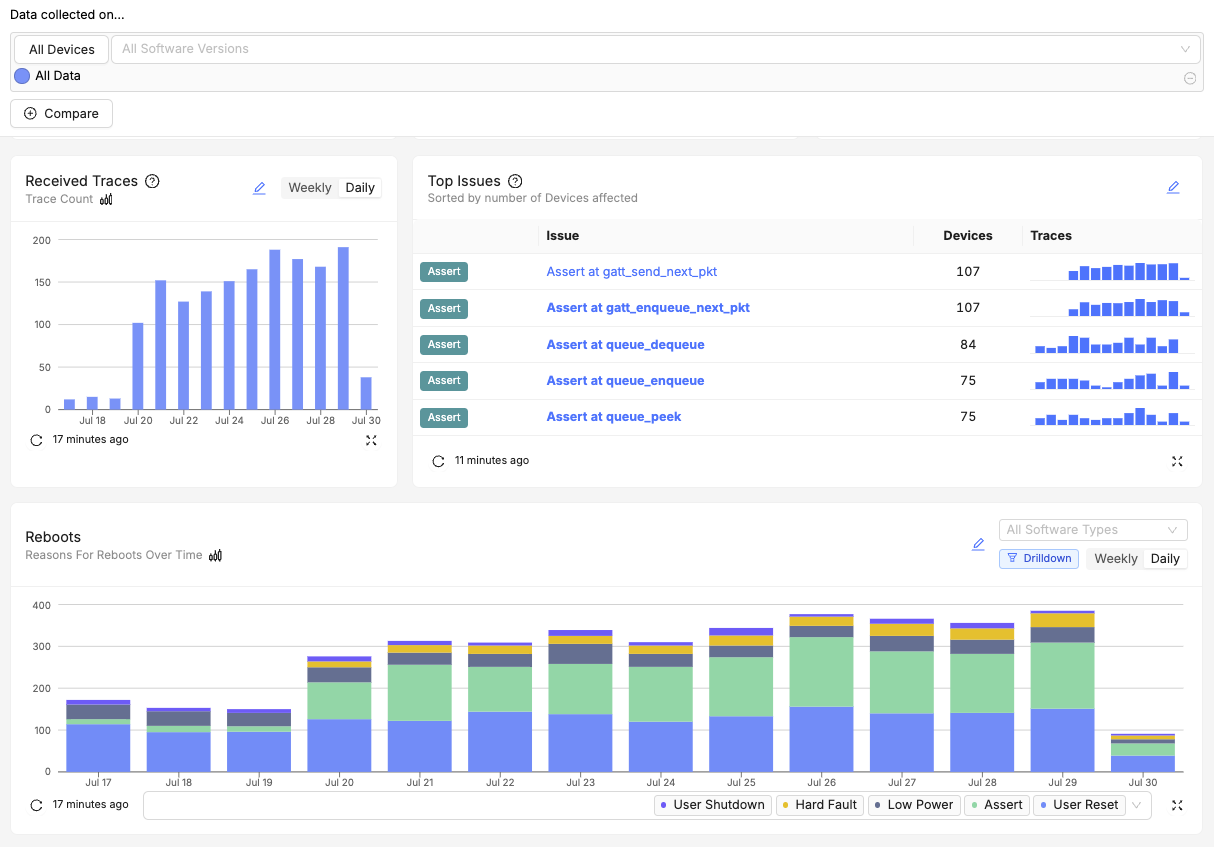
Automatic tracking and prioritization of problems
- Related issues automatically grouped together so you never waste time looking at the same issue twice
- Prioritize issues based on impact with a trace count and impacted device count for every issue
- Get alerts when new issues are identified so you can investigate straight away
- Understand which versions have issues at a glance and easily identify affected devices
Built for embedded devices
Memfault gives your embedded development team a set of modern software development tools to help them find and fix faults efficiently, and develop and maintain great connected products. It's purpose built for embedded devices, will work with your specific set-up and saves your team from wasting time maintaining custom systems.
Monitor
Collect and track key health and performance metrics from every device in your fleet. Spot trends with our built in tools and set automatic alerts for when things go wrong.
LEARN MOREAnalyze
Understand product usage, performance and reliability like never before. Collect product usage data from every device in your fleet even when they aren’t connected.
LEARN MOREDeploy
Rollout OTA software updates across your fleet with control and precision. Monitor the rollout with built in tools, set automatic alerts and abort with a single click if required.
LEARN MOREResources
Deep Insights into Device Debugging
Airthings Case Study
With Memfault and utilizing coredumps, the Airthings team can now quickly pinpoint issues and remotely debug their devices.
Read the Case StudyRecorded Panel: Debugging Embedded Devices in Production
Hear from engineering experts as they discuss their success stories and lessons learned from debugging in production
Watch NowDocumentation: Introduction to Debugging with Memfault
Read our docs to learn more about debugging with Memfault and how to track crash analytics.
Read More


