Skip to the content

Share
Embedded teams need better tools to troubleshoot issues quickly and enhance product quality. Discover how our latest product update transforms the value of logs collected from your devices.
Logs are a critical component to the vast majority of debugging workflows, regardless of which sphere of software development you work in. Embedded development is no different.
Teams still rely heavily on logs to solve problems. However, in many cases, it’s a struggle. Just collecting logs is one thing. But even if you are collecting logs, working with them is clunky, time consuming, and often incredibly frustrating.
The status quo of log usage in embedded development reveals three common challenges:
- Limited visibility: Capturing logs from devices running in real-world environments is difficult, leading to incomplete data for diagnosing issues.
- Lack of scalability: As devices scale in complexity and volume, managing and analyzing large amounts of log data becomes overwhelming.
- Time-consuming process: Developers spend excessive time manually sifting through raw logs, searching for patterns or anomalies.
It’s about time embedded development teams got some good logging tools. So we built some.
Introducing Log Management and Analytics from Memfault
Memfault has always enabled users to collect log files from embedded devices, specifically automating the collection of logs when a device experiences a crash or error. However, simply associating logs with crashes doesn’t make logs much more efficient. You still need to search through them line by line, you can’t analyze them at scale, and it is very time consuming.
With our new Log Management and Analytics feature set, that all changes. Logs are automatically captured every time your device crashes or encounters an unexpected error. Users can also configure regular intervals for log collection. But collection is only the first part of the puzzle, the real power happens once you get the data, and now in Memfault you can:
- Get logs automatically associated with every trace of a crash or unexpected error
- Easily search across logs you’ve collected from any device, all in one place
- Filter log searches using Memfault data like software version or issue
- Correlate your log data with other Memfault insights and view everything in a concise summary
- Monitor and analyze trends in log data over time with charts and filtering options
This will save you hours on every investigation, turning your existing logs into a tool for fleet-wide insights.
No more digging through logs one by one. Jump straight to the logs that matter, filter and search with ease, and with a click, see how often this log line has appeared across all traces of an issue or in the logs collected from any device.
Fleet-Wide Insights with Powerful Controls
Devices are at the heart of everything we have built. This means your controls over log data collection and ingestion are designed with fleets of devices in mind, not servers or apps.
We give you both device-side and server-side controls for the collection of log data to try and ensure you never blow through a quota and lose visibility when it matters most. We don’t want a couple of bad devices spamming logs to mean you no longer have any quota left to collect logs from the rest of your fleet.
The device-side control also means you can collect logs on your devices without sending them, and then turn on logging in an emergency to pull retrospective logs from those devices. This can keep things ultra efficient.
Seamless Integration—No Changes Required
The best thing? In order to take advantage of the search and analytics capabilities you don’t need to make any changes to your logging implementation. Assuming you already have the Memfault SDK installed, all of the enrichment that allows you to filter, correlate, and search your logs happens automatically.
If you’re not using Memfault yet and want to get started, reach out to our team. We’ll guide you through the integration process—on some platforms, it can take just a few hours. For more complex projects, we offer full implementation support.
Ready to see how it works?
Deep Dive Into Log Management and Analytics
Keep reading for a more detailed description of what’s new.
Automatic Log Collection and Enrichment
Once our SDK is integrated into your firmware, Memfault will automatically collect logs with every trace of an issue and can also collect logs periodically from your devices. And with this new feature set, we automatically enrich your log data without you having to do anything. By default your logs will be enriched with:
- Issue and Trace ID (if collected with a trace)
- Software Version on device
- Hardware Version
- Cohort
- Time captured
- Time collected
If you are already collecting data with Memfault, you get the advantage of more detailed log data without needing to change your logging implementation or increase the volume of data you are sending, since the enrichment happens server-side.
If you aren’t using Memfault yet, rest assured that everything we do is purpose-built for constrained embedded systems. So if this sounds interesting, but you are unsure if you have the bandwidth to implement it, reach out to us—we’re here to help.
If you aren’t collecting logs, this is a really good reason to start! With logs automatically collected for each trace, you can jump right into the logs that matter when there is a problem. You’ll never need to worry about manually digging through files to find the most relevant information.
Fleet-wide Log Search and Analysis
One thing that makes this new feature set so exciting is that it allows you to examine all your log data in one place. This eliminates hours of manual effort and makes logs a tool for fleet-wide insights.
Depending on the entry point for your investigation, there are three ways to access your logs:
1: “Log Explorer” tab
All of your logs can be accessed from the new “Log Explorer” tab from the main menu. This tab displays all the logs reported from every device in your fleet, along with information about the device and whether the log was collected with a trace or associated with an issue.
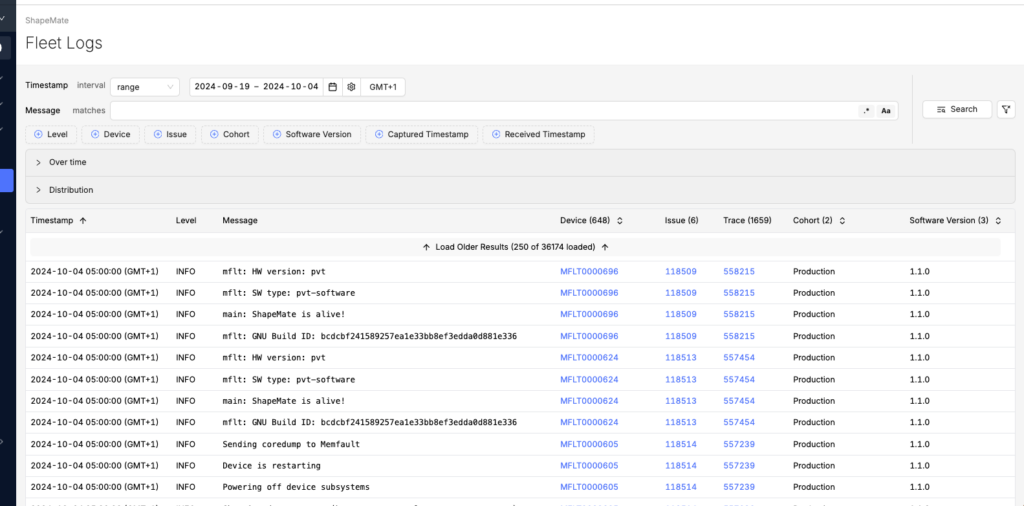
Viewing all logs collected from our fleet.
2: “Trace Logs” tab
You can also view logs associated with a trace in the “Trace Logs” tab within the Issue view, as shown below. In this view, you can search through the logs from that specific trace and then extend your search to include all logs from all traces of that issue. This makes it quick and easy to test your theory if you spot something in the logs that might be contributing to the issue.
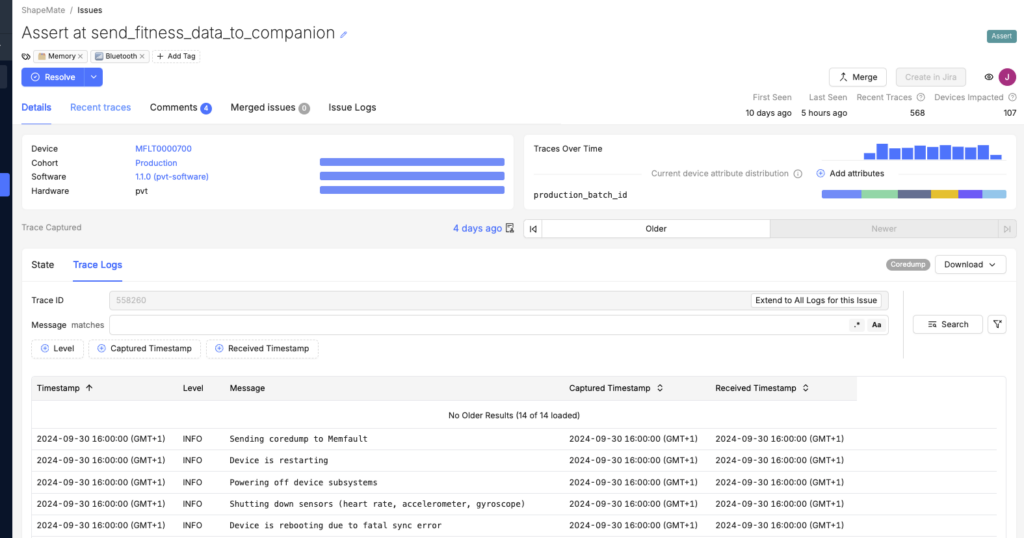
Viewing logs from this unique trace.
With a click, you can extend your filtered search to all traces of this issue and quickly see how frequently it appears across all associated logs, as shown below. When viewing all logs that match your search, you can instantly see how many devices reporting the issue have logs that match your criteria. Similarly, you can see how many traces of this issue also include that log line. In the example below, the summary points in both the Device and Trace columns are 100% for our search, suggesting strong correlation.
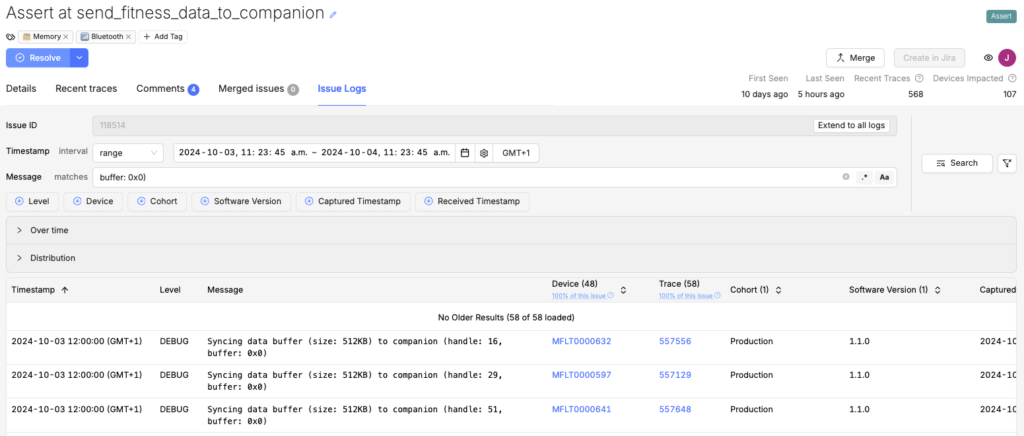
Viewing all logs from an issue that also match our search for “buffer:0x0)” and reported within our defined time range.
3: “Device Logs” tab
Users can jump straight into logs collected from specific devices in the “Device Logs” tab within the Device Details view. Here, you can search all logs from that device, and once again extend your search to all logs collected from any device.
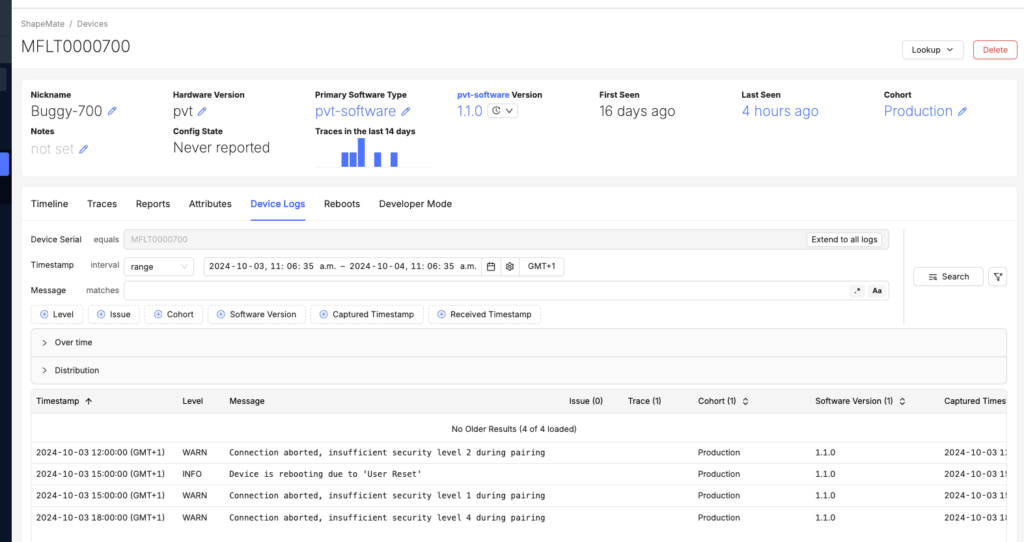
Viewing all logs collected from device “MFLT0000700” within a defined time range.
Users have access to detailed filtering and search capabilities. In the example below, we are searching logs from a single device within a defined time range and filtering using:
- Message = “buffer”
- Level = DEBUG
- Software version = 1.1.0 AND 1.1.1
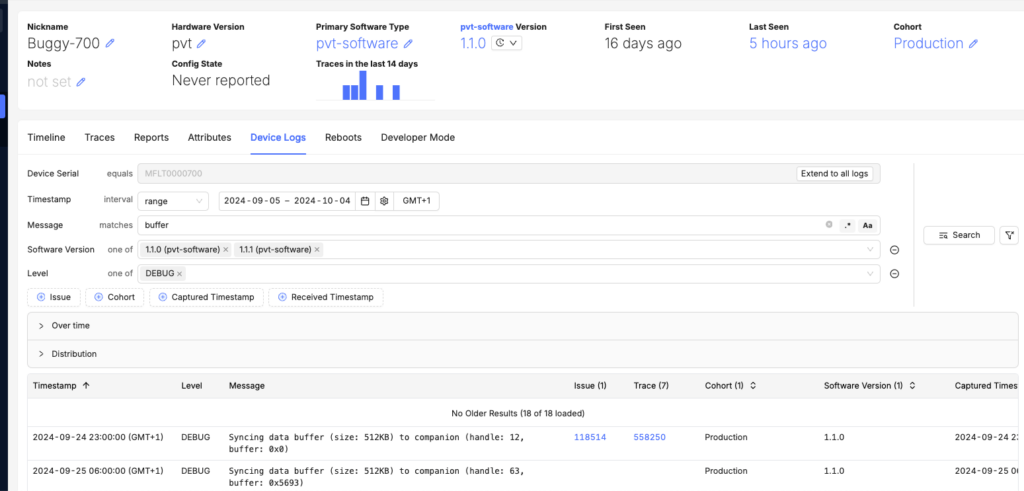
Filtering search of logs from this device using message, software version and level.
Other available filters include:
- Cohort
- Captured and received time
- Device serial
- Issue ID
- Log source
These filtering capabilities make it much faster to find the information that matters. Then, by clicking “Extend to all logs”, your search criteria is carried through to a search of logs collected from all devices (or from all traces if viewing issue logs).
Summary charts and correlations
Users have access to powerful analysis and trend spotting tools.
Within the various log search views, users can access useful data visualizations. The first is an “Over time” chart with the ability to view counts by device, logs, cohorts, or traces, as well as the ability to group data by software version or log level. This allows you to quickly identify trends in your log data.
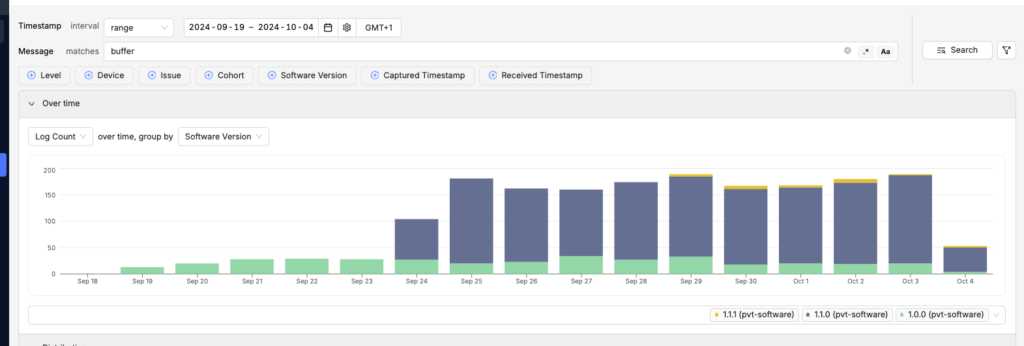
Viewing a count of logs collected within a defined time range that match our text search for “buffer” and viewing the data grouped by software version
Users will also be provided with an at-a-glance “Distribution” of logs matching their search across log level, cohort, software version, hardware version, and issue. This is illustrated in the horizontal bars, which show that this search is present in three software versions and two separate cohorts. Using this functionality, you can quickly test your theories and understand the impact of specific issues across your fleet.
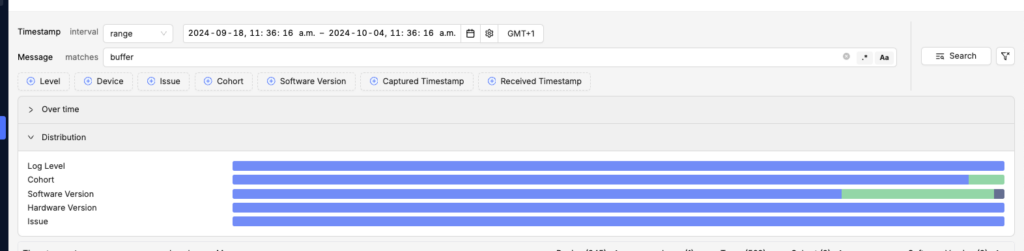
Viewing the distribution of log data across Log level, Cohort, Software Version, Hardware Version and Issue.
Device-centric control of collection and ingestion
Everything Memfault does is designed for teams that care about devices. Management of your logging data collection is no exception.
Many other logging tools designed for servers or applications can lead to subpar experiences, especially if your primary focus is on devices. We’ve worked to minimize these poor experiences as much as possible, particularly in the areas of collection and ingestion.
We provide both device-side and server-side controls for log collection and ingestion. These tools enable you to specify how many of your devices send logs, while also allowing you to independently manage how many devices store logs locally. This means that if you have a large fleet, you don’t need to send logs from every device; instead, you can collect logs from a sample of your top priority devices, helping to keep costs down. Additionally, if you have devices that are storing logs but not actively sending them, you can activate log transmission in an emergency. Memfault will then retrieve the stored logs, allowing you to “look back in time” on those devices.
Not only do these controls help keep costs down, but they also maintain efficiency. There are a number of reasons why you might not want all your devices sending logs all the time, and these tools give you complete control.
Transforming Log Management and Analytics for Embedded Devices
Logs have long been a fundamental aspect of observability beyond embedded development. We’re excited to bring that same level of effectiveness and ease of use to logs for embedded devices.
Many embedded teams rely heavily on logs and want to be more efficient. Some struggle to get value from their logs at all due to the complexities of collection and analysis. No matter where your team falls on this spectrum, we’re here to help.
Our new Log Management and Analytics offering simplifies log collection, accelerates investigations, and transforms your logs into accessible, fleet-wide insights.